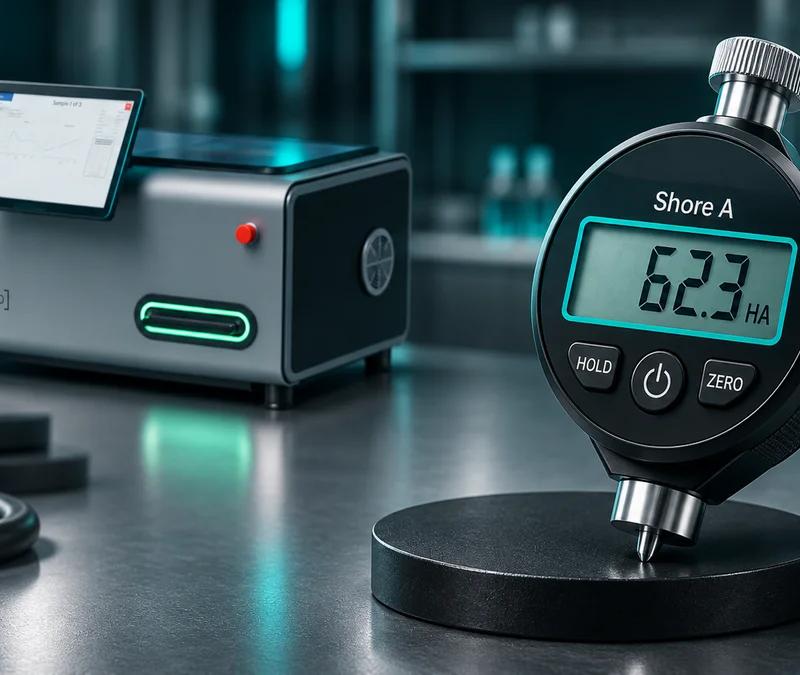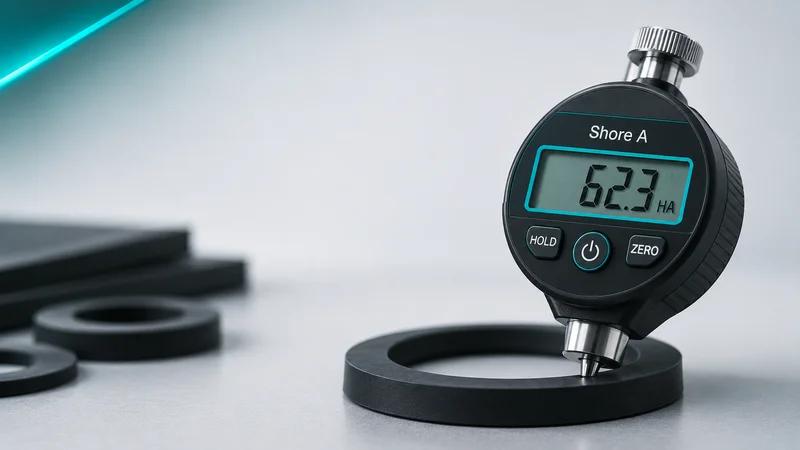
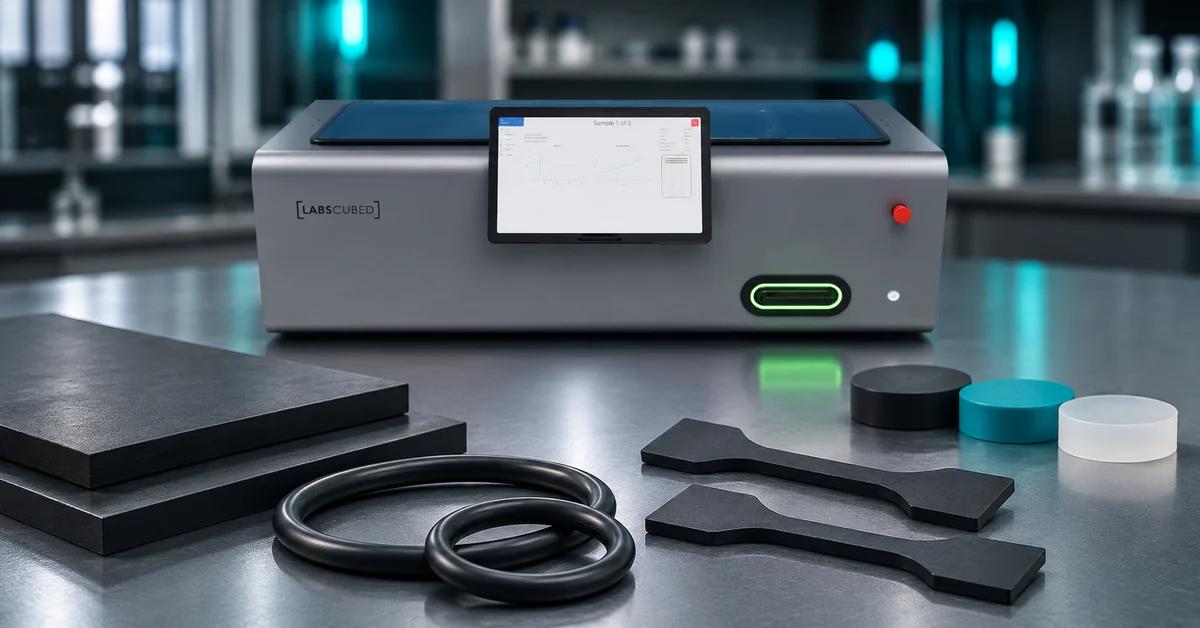
EPDM rubber Shore hardness typically falls between 30 and 90 Shore A, with most commercial sheet, seal and gasket grades sitting in the 50–80 Shore A band and 60–70 Shore A the single most-specified range. LabsCubed builds the robotic tensile systems — CubeOne and CubeTen — that QA labs use to verify those compounds.
That range is the easy part. This guide covers what an EPDM hardness number actually tells you: which scale to use, what ASTM D2240 requires of the specimen, why the same sheet reads differently in two technicians' hands, and where hardness stops being useful.
What is EPDM rubber Shore hardness?
EPDM rubber Shore hardness is the resistance of an ethylene propylene diene monomer compound to indentation by a spring-loaded durometer, reported on the dimensionless Shore A scale. It is a surface measurement, not a strength measurement, and the scale letter is part of the result — 70 Shore A, never a bare 70.
EPDM is a saturated-backbone elastomer used where weather, ozone, steam and polar fluids are the problem: roofing membrane, automotive weather seal, HVAC gasketing, potable-water seals. Its hardness is not an intrinsic property of the polymer but a formulation outcome, set by filler loading, plasticiser content and degree of cure. Two EPDM compounds with identical hardness can behave very differently in service, which is why hardness alone never qualifies a lot.
In practice hardness earns its place because it is fast. A durometer reading takes seconds and needs no specimen preparation, so it is the natural first check on incoming material and on cured parts coming off a press. In most rubber testing workflows it functions as a process-control indicator: a shift in hardness flags that something upstream — filler dispersion, cure time, batch substitution — has changed, and the slower mechanical tests then explain what.
What is the Shore hardness range of EPDM rubber?
Commercial EPDM spans roughly 30 to 90 Shore A. Soft sponge and low-durometer sealing grades sit at 30–50 Shore A, general-purpose sheet and weather seal at 55–75 Shore A, and load-bearing or abrasion-resistant grades at 75–90 Shore A. Values above about 90 Shore A are better reported on the Shore D scale.
Treat the bands below as indicative for specification discussions, not as substitutes for a supplier datasheet or a tested lot certificate.
| Typical hardness | EPDM grade type | Where it is normally used |
|---|---|---|
| 30–45 Shore A | Soft / low-durometer | Low-closure-force seals, soft gaskets, vibration pads |
| 50–60 Shore A | Flexible sheet and extrusion | Weather stripping, door and window seals, roofing membrane |
| 60–70 Shore A | General-purpose commercial sheet | The most commonly specified band: gaskets, O-rings, gaskets for HVAC and water |
| 70–80 Shore A | Firm / higher-filler | Higher-pressure sealing, bushings, components under sustained load |
| 80–90 Shore A | Hard / abrasion-resistant | Wear surfaces, structural mounts, rollers and pads |
One convention worth knowing: ASTM D2000, the classification system most rubber specifications are written against, calls out durometer hardness in increments of five, with a tolerance normally of ±5 points. So a line callout asking for 70 Shore A is really asking for 65–75. If your lab is arguing over a two-point difference, the specification is usually not the reason.
Which is harder, Shore A or Shore D?
Shore D measures harder materials than Shore A. They are separate scales, not a continuous one: Shore A uses a blunt 35° truncated-cone indenter with a light spring, Shore D a sharp 30° conical indenter with a spring roughly five times stiffer. The same specimen reads a much lower number on Shore D than on Shore A.
The practical selection rule in ASTM D2240 is straightforward. Use Shore A for elastomers; if a reading exceeds about 90 Shore A, the scale is saturating and Shore D is the better instrument. Conversely, if a Shore D reading falls below about 20, switch back to Shore A. Nearly all EPDM sits comfortably inside the Shore A window, so a Shore D value on an EPDM datasheet is unusual and worth querying.
There is no valid conversion equation between the two scales. Published conversion charts are approximations built from specific material sets, and applying one to a filled EPDM compound introduces error no downstream calculation can remove. If a specification names a scale, measure on that scale.
How is EPDM Shore hardness measured under ASTM D2240?
ASTM D2240 requires a specimen at least 6 mm thick, flat and parallel, with indentations placed at least 12 mm from any edge and spaced apart from each other. The durometer foot is applied without shock, the reading taken at one second unless the specification states otherwise, and five readings are taken with the median reported.
Thinner material may be stacked to reach the 6 mm minimum, but the standard limits this to three plies sitting flat against each other. Stacking a curved extrusion or a moulded seal profile is a common source of low readings, because trapped air under the plies behaves like a soft layer. Where part geometry cannot be tested honestly, use a moulded slab from the same batch.
Temperature matters more with EPDM than most technicians expect. The standard test condition is 23 ± 2 °C, and a sheet brought straight in from a cold store can read several points high until it equilibrates. ISO 48-4 is the international counterpart method (superseding ISO 7619-1), and while the two are closely aligned, results should be reported against the method actually used.
Hardness is also where a QA workflow branches. The durometer answers "has this compound changed?"; it cannot answer "will this seal hold?". That belongs to tensile strength, elongation at break and modulus, measured under ASTM D412 and ISO 37 tensile testing for rubber.
Why do EPDM hardness readings vary between operators?
Because four variables in a manual durometer reading are uninstrumented: how fast the foot is applied, how much hand pressure is behind it, exactly when the number is read, and where on the specimen the indenter lands. None of these are recorded, so the resulting scatter looks like material variation when it is really technique variation.
EPDM is particularly exposed to the timing variable. Filled elastomers creep under the indenter, so the needle drifts downward after contact. An operator reading at one second and an operator reading at three will disagree by a few points on the same sheet, consistently, and both will believe they are right. Multiply that across a shift change and the control chart shows steps that have nothing to do with the compound.
Surface condition adds a second layer: mould release, a slight crown on an extruded profile, or a reading over an internal void will all pull a value off. The classic tell is a lot that fails incoming inspection on hardness, passes a re-test by a different technician, then passes tensile testing without complaint.
Manual vs. automated EPDM rubber testing
Automation does not make a durometer more accurate in principle. It changes everything around the measurement: specimen handling, timing, sequencing and the record.
| Factor | Manual bench workflow | Automated system (CubeOne / CubeTen) |
|---|---|---|
| Timing and dwell | Judged by eye, rarely timed or logged | Fixed to the method and recorded per specimen |
| Specimen alignment | Hand-placed; grip and indenter position vary | Robotic placement to programmed coordinates |
| Operator-to-operator drift | The dominant source of scatter | Removed from the controlled steps |
| Tensile follow-up | Separate session, often days later | Same queue, unattended, typically overnight |
| Data capture | Transcribed by hand, re-keyed into the LIMS | Written directly to the record at test time |
| Audit trail | Final result only | Specimen ID, parameters, curve, timestamp, operator |
| Throughput | Bounded by technician availability | Bounded by the queue, not the shift |
The gain that matters to a rubber QA lead is rarely speed on a single test. It is that a batch of EPDM specimens can be loaded once and run with identical parameters applied to every one, so month-over-month trend data is comparable. We cover that in depth in our guide to the automated rubber tensile testing machine and in the wider view of lab automation robotics for plastics and rubber QA teams.
How does EPDM compare with neoprene, nitrile and silicone?
All four elastomers are normally specified on the Shore A scale and their commercial ranges overlap heavily, so hardness is a poor way to tell them apart. EPDM typically runs 30–90 Shore A, neoprene about 40–80, nitrile roughly 40–90 and silicone around 20–80. Chemical and thermal resistance, not hardness, drive the material choice.
This overlap causes real specification errors. A 60 Shore A neoprene and a 60 Shore A EPDM feel identical in the hand and pass the same durometer check, yet neoprene handles oils that EPDM swells in, while EPDM tolerates steam, ozone and brake fluid that degrade neoprene. Hardness confirms a compound is what it was last time; it does not confirm which compound it is.
Two properties matter more than hardness for long-service EPDM parts: compression set, which determines whether a seal recovers after years under load, and ageing resistance under heat and ozone. Neither correlates reliably with a durometer reading. For dynamic parts, cyclic behaviour matters too — the reasoning in fatigue testing in rubber compounds applies directly to EPDM mounts and bushings.
Common mistakes when specifying EPDM hardness
Most EPDM hardness disputes trace back to a handful of avoidable errors:
- Writing a hardness number without a scale or a method. "70 durometer" is ambiguous. "70 Shore A per ASTM D2240" is actionable.
- Ignoring the ±5-point tolerance. ASTM D2000 callouts are written in five-point increments; rejecting a lot for a three-point deviation is usually rejecting measurement noise.
- Testing the finished part when geometry does not allow it. Thin, curved or ribbed sections cannot meet the 6 mm thickness and 12 mm edge-distance requirements. Use a moulded slab from the same batch.
- Taking a single reading. The method calls for five and a median. One reading on a filled compound is a data point, not a result.
- Treating hardness as a strength proxy. A harder EPDM is stiffer, not stronger, and often lower in elongation.
- Comparing readings taken at different temperatures. Without equilibration to 23 ± 2 °C, a few points of apparent drift are the room, not the rubber.
Frequently asked questions
What is the Shore hardness of EPDM rubber?
EPDM rubber typically measures between 30 and 90 Shore A. Most commercial sheet, gasket and weather-seal grades fall in the 50–80 Shore A band, and 60–70 Shore A is the most frequently specified range. The exact value is set by filler loading, plasticiser content and cure, not by the base polymer.
Which is harder, Shore A or Shore D?
Shore D covers harder materials. It uses a sharp 30° conical indenter and a much stiffer spring than Shore A, so the same specimen reads a far lower number on Shore D. Use Shore A for elastomers such as EPDM, and switch to Shore D only above roughly 90 Shore A.
Is 70 Shore A a standard EPDM grade?
Yes. 70 Shore A is the most widely stocked EPDM sheet and seal grade, and ASTM D2000 callouts are written in five-point increments, so 70 is a natural specification point. Under a typical ±5-point tolerance, a compliant 70 Shore A lot may measure anywhere from 65 to 75.
What is the Shore A hardness of neoprene rubber?
Commercial neoprene sheet typically measures about 40–80 Shore A, most often 50–70. That overlaps EPDM almost entirely, so hardness cannot be used to distinguish the two materials. Chemical resistance is the deciding factor: neoprene handles oils, EPDM handles ozone, steam and polar fluids.
Does EPDM get harder as it ages?
It can. Prolonged heat exposure typically drives continued crosslinking, which raises hardness and lowers elongation, while some ageing paths soften the surface instead. EPDM resists ozone and UV well by design, so hardening is usually thermal. Heat-ageing tests, not a single durometer reading, characterise the effect.
Does a higher Shore A number mean stronger EPDM?
No. Higher hardness means greater resistance to surface indentation, which usually tracks with higher stiffness and often with lower elongation at break. Tensile strength does not follow hardness reliably. Strength and sealing performance still require tensile, compression set and ageing data.
Is your EPDM data telling you about the compound or about the technician?
Talk to LabsCubed about running rubber tensile and QA testing as one automated, auditable workflow with CubeOne or CubeTen.
Get a quoteLabsCubed Team
The LabsCubed engineering team builds robotic materials-testing systems for plastics, rubber and composites labs. We work daily with ASTM and ISO tensile, hardness and ageing methods, and with the QA teams who have to defend the numbers. Published 12 August 2026 · Last updated 12 August 2026.